Process Flow Diagram
A process flow diagram (PFD) is a type of diagram that illustrates the relationships between key components in a process or system. It is often used in engineering, chemical processes, manufacturing and other areas where processes need to be visualized and understood.
A typical process flow diagram includes various elements such as equipment, piping, instruments, valves and other components involved in the process. It shows the flow of materials, energy and information through the system and indicates how the various components interact.
Process flow diagrams are essential tools for engineers and designers to understand the overall process, identify potential problems or bottlenecks, optimize the system and communicate the process to other stakeholders. They provide a visual representation of the process that helps analyze and improve system efficiency, safety and reliability.
Overall, process flow charts are valuable tools for designing, analyzing and optimizing processes in various industries to ensure smooth operation and effective management of resources.
Depending on its use and content, it can also be called a Process Flow Chart, Flowsheet, Block Flow Diagram, Schematic Flow Diagram, Macro Flowchart, Top-down Flowchart, System Flow Diagram or System Diagram.
History
This type of diagram originated in the 1920s. In 1921, industrial engineer and efficiency expert Frank Gilbreth, Sr. introduced the "flow process chart" to the American Society of Mechanical Engineers (ASME). In the following decades, the concept spread throughout industrial engineering, manufacturing and even business, in the form of Business Process Diagrams, and information processing, in the form of Data Flow Diagrams and other diagram types.

Icons and Symbols
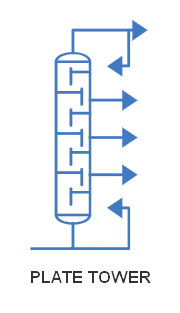
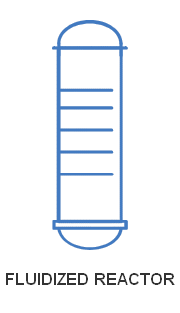
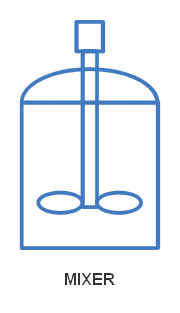
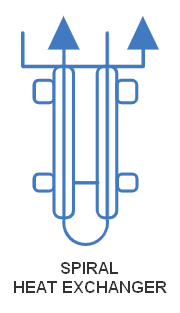
The icons and symbols used in process diagrams vary depending on the type of diagram, but they all share a common purpose: to represent the sequence of events and activities required to complete a task. Process diagrams can be used to illustrate everything from the manufacturing process to a new product.
Below some examples..


Purpose and benefits
A Process Flow Diagram has several purposes..
- To document a process for better understanding, quality control and employee training.
- To standardize a process for optimal efficiency and repeatability.
- To study a process for efficiency and improvement. It helps to show unnecessary steps, bottlenecks and other inefficiencies.
- To model a better process or create an entirely new process.
- To communicate and collaborate with diagrams that address different roles in the organization or beyond.
Differences between PFD’s and P&ID’s
Piping and Instrumentation Diagrams (P&IDs) are often confused with Process Flow Diagrams (PFDs). P&IDs and PFDs generally use the same notation for teams. However, they serve different purposes and provide different information. The purpose of a PFD is to show exactly what a process does during operation, and a P&ID shows all controllers, valve types and materials used in construction.
A PFD shows the connectivity and relationships between the major equipment and units of a process. However, it also contains tabulated design values, such as normal, minimum and maximum operating conditions, that a P&ID does not contain. A PFD does not contain small piping systems or other small components that a P&ID normally contains.
The difference between P&IDs and PFDs is that P&IDs typically contain more information about piping, control and safety valves than process flow diagrams. P&IDs do not contain operational specifications that PFDs do, such as flows and flow compositions. It should be noted that the differences between PFDs and P&IDs can vary from plant to plant. Most plants have standards for creating and modifying these documents.
Both PFDs and P&IDs are controlled documents and must be maintained with a document control procedure.
Related Post(s)

The piping and Instrument Diagram (P&ID) provides a schematic representation of the piping, process control, and instrumentation which shows the functional relationships among the system components...